
How can I find out how much energy my heating system consumes using the ‘Price-Comfort’ indicator?
Degree-Day: how much energy do I need to heat my home?
The amount of heating you need depends on :
-
-
- the outside temperature, which you cannot control,
- the temperature inside the home you choose,
- the quality of your home's insulation, which you can improve by carrying out renovation work.
-
For example, if it's 0°C outside and you want an inside temperature of 18°C, you need 18 degrees of heating. If it's -10°C outside, you'll need 28 degrees of heating.
With weather data, we know the outside temperature at every hour of the day. This gives us the number of degrees of heating required for each day, known as ‘Degree-Days’, or Heating Degree-Days (HDD). By adding up the degree-days for all the days in the month, we know the heating requirement for the month.
This makes it possible to compare different regions. Typically, twice as many degree-days are needed in Est France as in Corsica! In France, for an average winter, the number of HDD is between 2,200 and 2,800, varying from 1,400 in Corsica to 3,800 in the Jura of Eastern France.
You can also compare different winters, and the higher the number of HDDs, the harsher the winter.
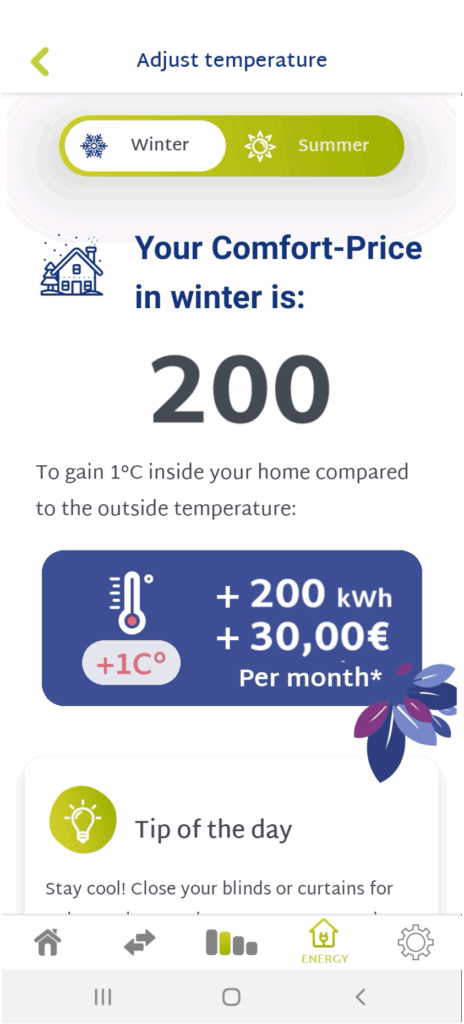
And, of course, you can also estimate your energy consumption using the ‘price-comfort’ indicator.
What is the ‘price-comfort’ indicator?
Using degree-days, we know your energy requirements for heating. By looking at your past energy consumption (oil, gas, electricity), we know how much energy you have used.
 Relationship between the quantity of energy consumed and the requirement in degree-day.
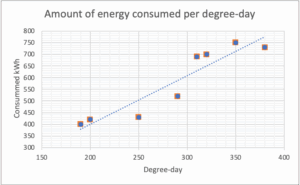
We can therefore plot these two data on a graph, for each HDD the amount of energy consumed.
As it happens, this graph looks very much like a straight line, which simplifies everything.
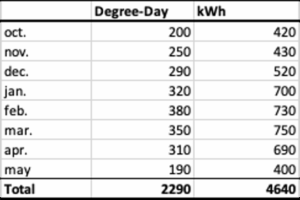
Typically, in the example below, which gives the degree-days and the amount of energy consumed for each month, we can see that for 200 degree-days, the people living in the house consume 400 kWh. And for 300 degree days you need 600 kWh of energy.
 The ‘price-comfort’ indicator is used to determine the amount of energy consumed as a function of the degree-day requirement.
In other words, for every 1 degree-day the combination (home, heating system) consumes 2kWh.
This constant of 2 kWh per degree-day is called the ‘Price-Comfort’.
It characterises both the energy performance of the home AND the heating habits of its occupants.
It corresponds to the slope of the straight line: the lower the slope, the fewer kWh you need to heat your home, so the lower the price you pay.
The lower the Price-Comfort, the less you pay for greater comfort!
And of course, the lower your Price-Comfort, the less CO2 you emit....
If you'd like us to help you work out your Price-Comfort, contact one of our experts by clicking here.
The ‘Price-Comfort’ indicator in a nutshell
The Price-Comfort is a very useful constant value for trying to predict your heating or air-conditioning energy consumption and your energy savings.
The colder it is, the more energy you need to maintain 18°C in your home: if it's zero degrees outside, you need to heat to 18°C, and your home will consume 18 times the Price-Comfort value. If it's 10°C outside, you only need to heat by 8°C to go from 10°C to 8°C, and the house only consumes 8 times the Price-Comfort.
The Price-Comfort depends on both your habits AND the quality of your home's insulation.
It's up to you to lower this value, in other words to pay less for more comfort!
If you decide to renovate your house to reduce your Price-Comfort, you should know that you can benefit from governmental subsidies.
How do you use the ‘price-comfort’ indicator?
We can think in terms of days, weeks, months or years, but it's easier to think in terms of months. And we can list at least 3 uses for the Price-Comfort indicator.
The Price-Comfort cannot be used to determine your heating consumption for the coming month, because we don't know what the weather will be like!
-
-
- However, the Price-Comfort does allow us to estimate next month's heating consumption based on a number of assumptions.
-
For example, if we anticipate a warmer month, April or May towards the end of winter, and if we think that the average outside temperature will be 14°C, then to heat the house to 18°C, we will need 4°C of heating for 30 days, or 120 degrees of heating.
Using the previous price-comfort value of 2 kWh, we can estimate that in April and May we will consume 240 kWh of energy. At 20 cents per kWh, the bill should come to around 48 euros per month.
-
-
- The other very practical use of the price-comfort is to compare consumption before and after renovation work. The price-comfort is an important indicator of your energy savings.
-
Based on past energy bills and weather data, your price-comfort is calculated immediately. Then, depending on the renovation work carried out, your works advisers will calculate your new ‘price-comfort’ indicator. You can then compare the price-comfort before and after the work. Then use these two values to calculate your energy savings.
-
-
- Finally, the price-comfort also categorises your heating habits. For the same home, heating consumption can vary from 1 to 10! Yes, young people are in swimming costumes, their parents in T-shirts, grandparents in jumpers and great-grandparents in jumpers with a shawl by the fire!
-
Once you know your price-comfort, you can try to lower it by changing the temperature in each room, lowering the thermometer a little, and so on. It's up to you to find the best solutions for lowering your price-comfort indicator.
Pay less and gain in comfort! Those are the best energy savings.
Who created the ‘price-comfort’ indicator?
This idea was born as part of a European research project on energy savings called FORTESIE.
The aim of this project is to massively increase energy-saving work based on incentive mechanisms for households and managers of tertiary buildings.
As part of the project, the companies European Dynamics and Compte CO2 felt that the linear regressions of energy consumption as a function of degree days, which are used by all energy suppliers, in particular to draw up energy performance contracts, were both essential and a source of confusion for users when calculating energy savings. The baseline scenario of past consumption, which is used to quantify energy savings, is always recalculated according to current weather conditions. These changes to the baseline, which form the basis of all energy performance contracts, are confusing for the user, as the reference for comparison changes all the time.
By using the slope of the linear regression line, which is constant, it is possible to compare consumption before and after the work, without changing the reference. The aim is to lower this value, to lower the bill, the price, in order to increase indoor comfort. This slope has come to be known as the ‘price-comfort’.
All this is possible thanks to the work of the thermal engineers who developed the degree-day concept. Well done to them!